 on 2 September 2026
 Build custom reports: your own analyses, no license, no install
Build custom reports straight inside DoliPlus, with no license to buy and nothing to install on your computer:
- A plain-English question turns into a figures list within seconds
- A visual builder: a starting record, filters, a sort order, a calculation
- Ready-made reports: revenue by month, by sales rep or by city
- A pie, bar or line chart, published straight into your own menus
- A one-click export to Excel, CSV or PDF, so you can carry on in your spreadsheet
- Your whole team gets access, and everyone only sees the data that concerns them
As a result, the answer arrives while the question is still fresh. Moreover, your business data never leaves your own installation.
DoliPlus is the enhanced cloud edition of Dolibarr, extended with modules built for daily business use.
Build custom reports without installing a connector
For a long time, a tailor-made analysis meant a technical detour. Indeed, you had to plug an external tool — Power BI, Excel — onto the database, then install a connector on your workstation.
That detour now belongs to the past. DoliPlus ships its own query builder, in the “Lists & reports” tab.
There, you simply type your question in plain words. For example, “revenue by sales rep this quarter” becomes a figures list within seconds.
Would you rather build it yourself? Then the workshop puts the settings on the left and the result on the right: the starting record, the columns, the filters, the sort order and the grouped calculation. Every change shows up immediately — as a list or as a chart, your choice, with nothing to confirm.
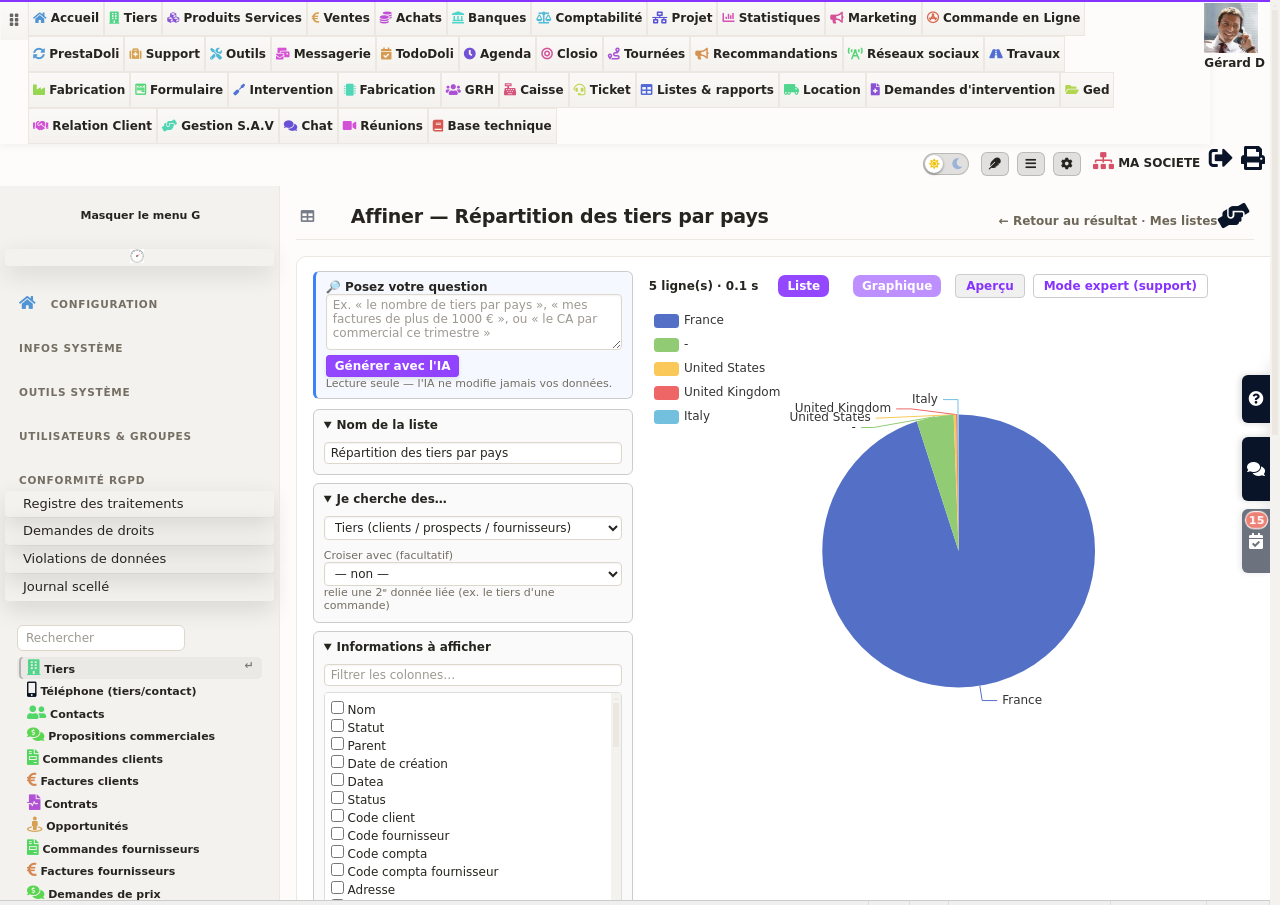
No line of code is required, therefore no technical skill either.
Your business data stays protected
The former direct link to the database — the one that connected Power BI or Excel to your session through a locally installed driver — is no longer offered. Indeed, it fails the security standards we apply to your data.
Three concrete reasons led to that decision:
- That link handed over an access that saw everything, outside DoliPlus permissions: a user restricted to their own customers still read payroll or margins
- The password then lived on a workstation, copied from one file to another, sometimes passed on to a third party
- Finally, it forced the database open to the outside world, whereas the rule is to keep it closed
The internal query builder, on the contrary, applies your permissions exactly like every other DoliPlus screen. Therefore everyone keeps their usual perimeter.
Moreover, every query stays read-only and leaves an auditable trace. In other words, you keep the same freedom of analysis without exposing the database itself.
Ready-made reports, one click away
Before you create anything, a catalogue of analyses is already waiting. Therefore many people build custom reports by starting from an existing one.
- Invoiced revenue by month, by sales rep or by customer city
- Rolling 12-month trend, plus the comparison with last year
- Customer breakdown by country or by city, as a pie or bar chart
- Invoices above a given amount, highest first
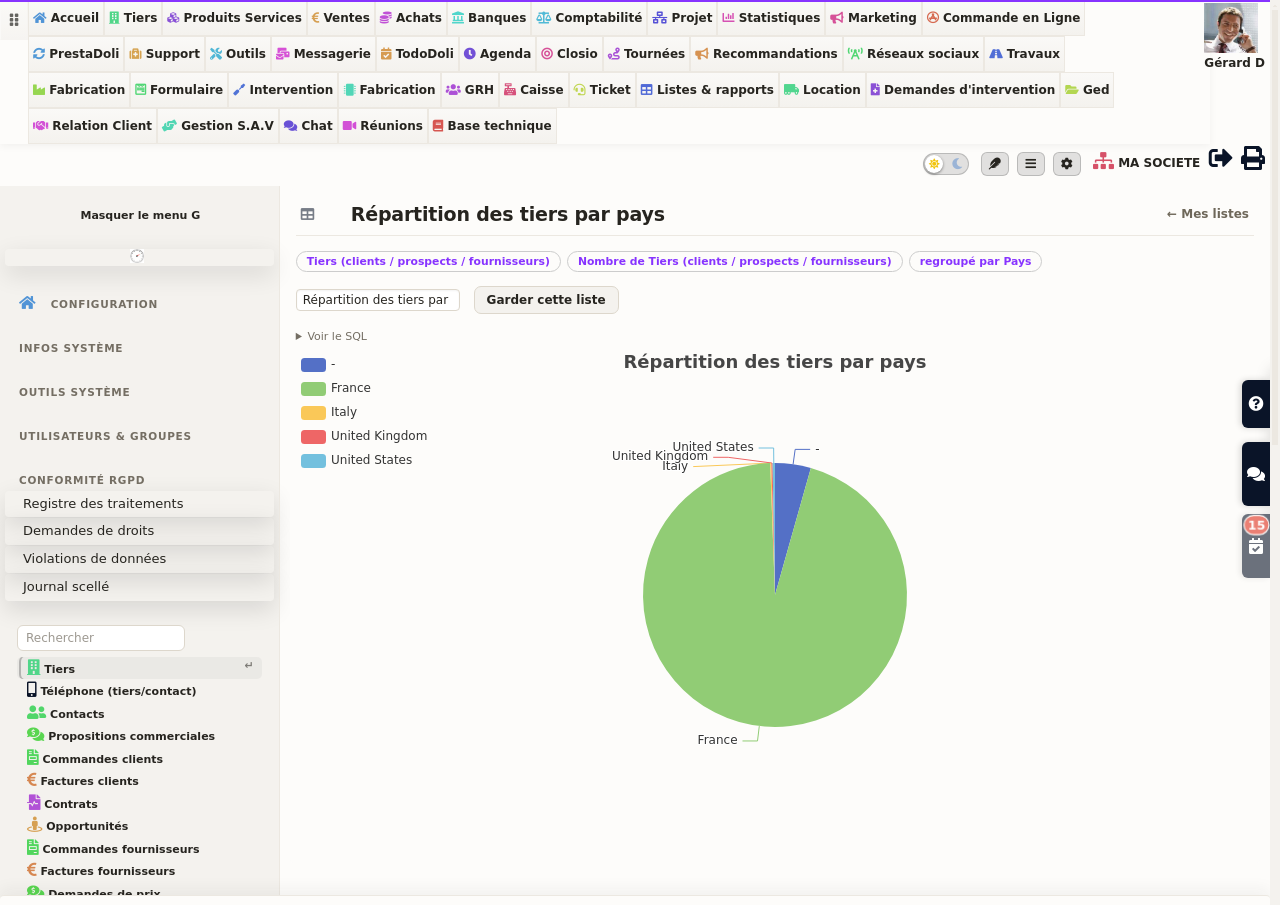
A question about breakdown opens straight as a chart — pie, bars or line, depending on what you asked. The list criteria stay visible above it, and the “List” toggle brings back the figures.
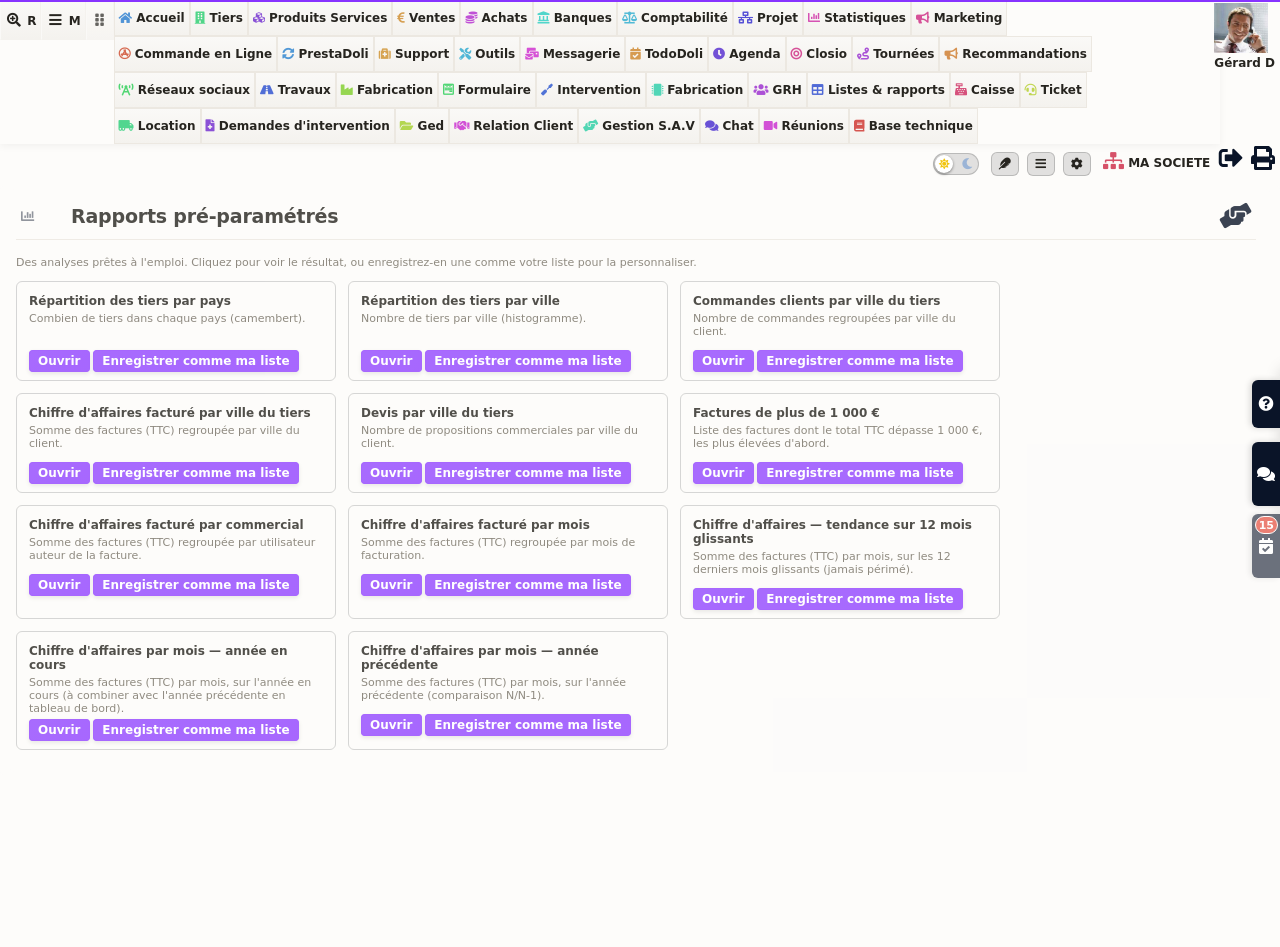
Each report opens as it is. Then the “Keep this list” button copies it across to you, so that you can adapt it to your own way of working.
For the indicators shown at login, see the customisable dashboard and the ready-made statistics as well.
One list already built: the customers who stopped ordering
Building a list is good. Finding one already built is better. DoliPlus now ships one with the module: Customers with no order in the last 6 months.
It answers a question nobody thinks to ask: who stopped ordering without saying a word? Those customers do not complain, they fade away. Six months later, nobody remembers them.
For each one, the list gives the date of their last order, how many months have passed since, how many orders they placed and the revenue they represented. You therefore see at once which ones were worth the most.
One detail matters: the Months without order column sorts and filters. The same list therefore serves for 3, 12 or 24 months, depending on the campaign you are preparing. Customers who unsubscribed from your mailings are excluded automatically.
Finally, this list exports like any other. You then reuse it as the recipient list of an e-mail or SMS campaign: see how to run the campaign.
Where to find your lists and reports
The query builder has its own tab in the top bar: Lists & reports. It opens four entries in the left-hand column.
- My lists: every list belonging to your company. Clicking a title opens the list.
- New list: the builder, with the plain-English assistant.
- Ready-made reports: the catalogue above, ready to open or to take over as your own.
A displayed list behaves like any other ERP screen: search, column sorting, paging. To adjust a column — its label, its format, its alignment, whether it can be filtered — simply click its heading from the list record. Your custom fields appear there alongside the standard ones.
Your figures in Excel: export in one click
Are you attached to your spreadsheet, or to your favourite analysis tool? Nothing stops you.
Indeed, every displayed list offers an export button: a CSV file, which opens with a double-click in Excel as well as in LibreOffice.
Therefore you get exactly the columns on screen, already filtered and sorted. Then you carry on wherever you like.
Ask your question in plain English, the list builds itself
Until now, getting a precise figure about your business meant one of two routes: opening a spreadsheet and copying rows by hand, or waiting for a developer to write a bespoke query. Either way, the delay between the question and the answer ran into hours, sometimes days.
The question bar reverses that order. You write your request the way you would put it to a colleague — “the number of companies per country”, “my invoices over £1,000”, “revenue per sales rep this quarter”. DoliPlus builds the matching list and shows it straight away, ready to read or to save.
You never write a query and never see any code. Therefore this capability is open to any user, not only to those who can code. Moreover, if the wording does not quite match your need, the visual builder sits right below to refine it by hand.
Questions sharper than a simple count
Four families of questions are worth knowing, because that is where the nuance lies:
- Who stopped buying? “Customers who have not ordered in 6 months” looks simple, yet it hides a trap: a customer with one old order is not inactive if they also ordered recently. The distinction is made, so your follow-up targets the right people.
- Who crosses a threshold? “Customers with more than 5 orders”, “invoices above £1,000”: the threshold applies in the right place, before or after grouping, depending on what the question really asks.
- A ranking, directly. “My best customers by revenue, in each country” ranks and groups in a single answer, where a spreadsheet would take several steps.
- A calculation already done. Average payment delay, margin: the value you asked for arrives calculated, rather than as raw columns to rework yourself.
Your permissions remain your permissions
Can an assistant able to build any list accidentally show forbidden data? No — and by design.
First, it only ever does one thing: read. It never changes, deletes or creates anything in your records. Then, it sees only what your permissions already allow elsewhere: a sales rep gets answers on their own accounts, never on a colleague’s, exactly as in their usual lists. Finally, sensitive information — passwords, technical tokens — stays out of reach in every circumstance.
Build custom reports day to day: step by step
- Open the “Lists & reports” tab, then click “New list”
- Type your question in plain words, or pick a starting record yourself
- Add your filters, your sort order and, if needed, a grouped calculation
- Choose a chart: pie, bars or line
- The result refreshes as you go, in front of you: nothing to click to see it
- Name the list, then save it
- Tick “Publish in a menu” to find it among your usual screens
A published list therefore becomes a page like any other. Your colleagues open it without rebuilding a thing, with their own permissions.
To go further on sorting, filtering and column display, read about dynamic tables.
Your whole team has access, each within their own perimeter
The query builder is meant for everyone, not just administrators. As soon as it is switched on for your installation, every user sees the “Lists & reports” tab, opens the catalogue reports and builds their own analyses.
That openness moves no boundary. A list returns only what the person running it is allowed to see: two colleagues opening the same report each get their own perimeter. A sales rep following their own customers will therefore never see their colleagues’, whatever list they use.
DoliPlus also keeps data separate company by company. Each company has its own lists: one created in a company does not show up in another.
Acting from a list, without leaving it
A list is not a dead end: what you see there, you can act on right away. From the displayed list you can put the records into a category, turn them into an e-mail campaign target, export them, or pin the figure as an indicator on your dashboard. Tick a few rows to act on those only, or tick none to act on the whole list — the count is announced before, and the report given after.
Open lists and reports on your installation
Were you using the former remote database access? Then our support team walks you through the move. Send us the reports you rely on, and we rebuild them with you inside DoliPlus.
In short, you win on both counts: your analyses stay tailor-made, and your data stays protected.
Write to support to open the query builder on your installation — and leave with your first report already built.
Related Entrées