 on 28 August 2026
 Ready-made business reports: your figures without a spreadsheet
The ready-made business reports in DoliPlus spare you from rebuilding your figures in a spreadsheet. Indeed, a whole catalogue of reports is already written and waiting for you:
- every management area covered — quotes, orders, invoices, purchases, stock, products, third parties, projects, accounting;
- a search box that finds a report from two words;
- the criteria actually applied, shown in plain language and removable in one click;
- your permissions enforced on every report, with a message telling you what to ask for;
- a period and filters to choose before each run;
- four output formats: screen, Excel, PDF and CSV;
- your targets and your margins followed in the same place;
- a reading proposed by AI as soon as the report runs, if you switch it on.
In other words, ready-made business reports take you from the question to the figure in a few clicks. Then you share the result without retyping it.
Since 2026, you no longer even have to open this menu to see your figures. Indeed, the customisable dashboard places your indicators straight on the home page and on each business screen. The detailed reports below remain, for their part, the in-depth analysis tool.
Ready-made business reports across every management area
The catalogue opens on the list of areas. Each area carries a series number, which lets you name a report without ambiguity.
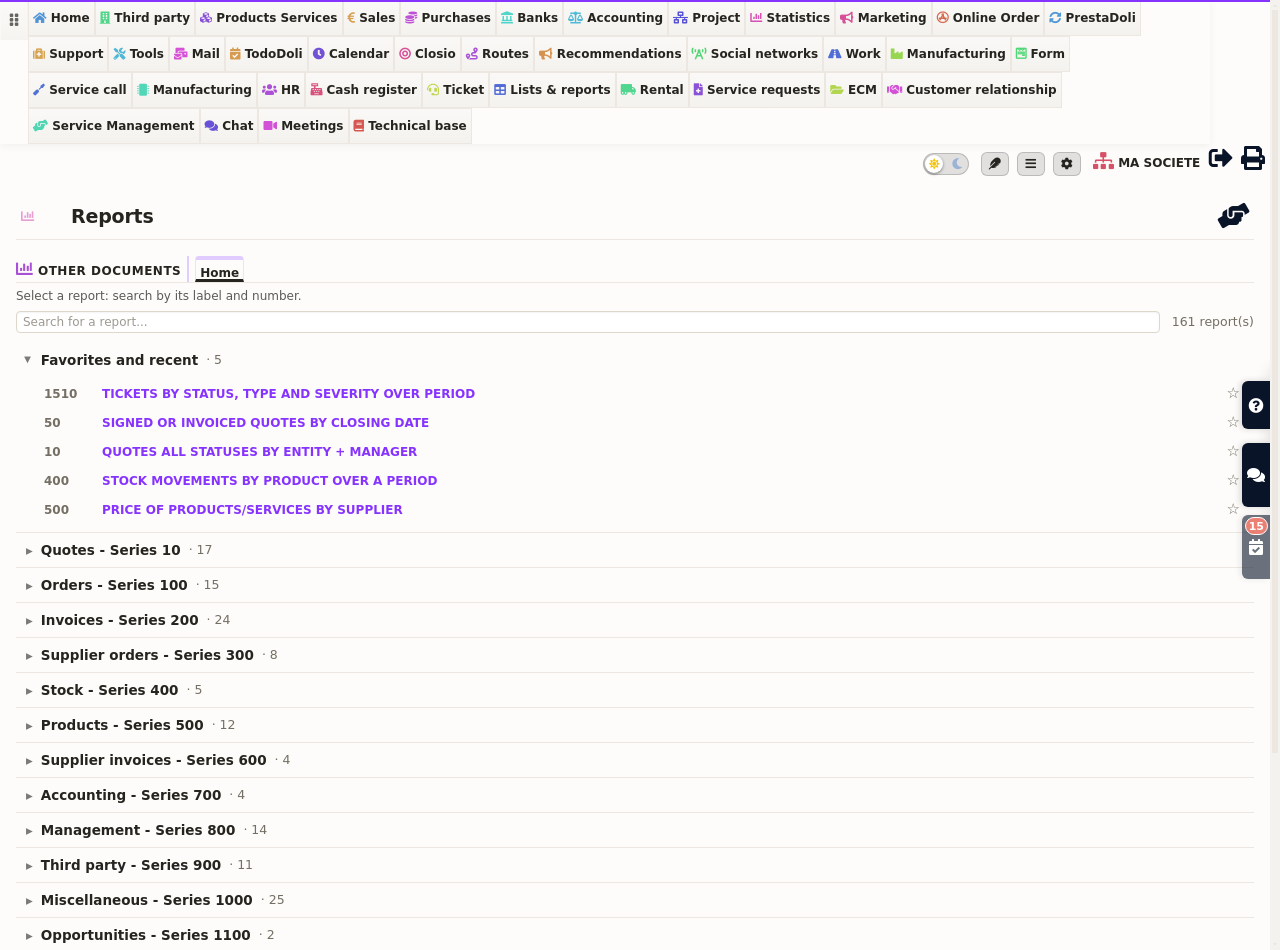
The best-stocked areas are naturally those of the sales cycle: invoices, quotes and customer orders. Moreover, a Miscellaneous area gathers the cross-cutting reports, which belong to no particular cycle.
Furthermore, you also find figures elsewhere in the software, without going through this menu: on the home page, on quotes and orders, and on Product and Service records.
Pick your report, then your period
Each area lists its ready-made business reports with an explicit label. Therefore you read what a report contains before running it.
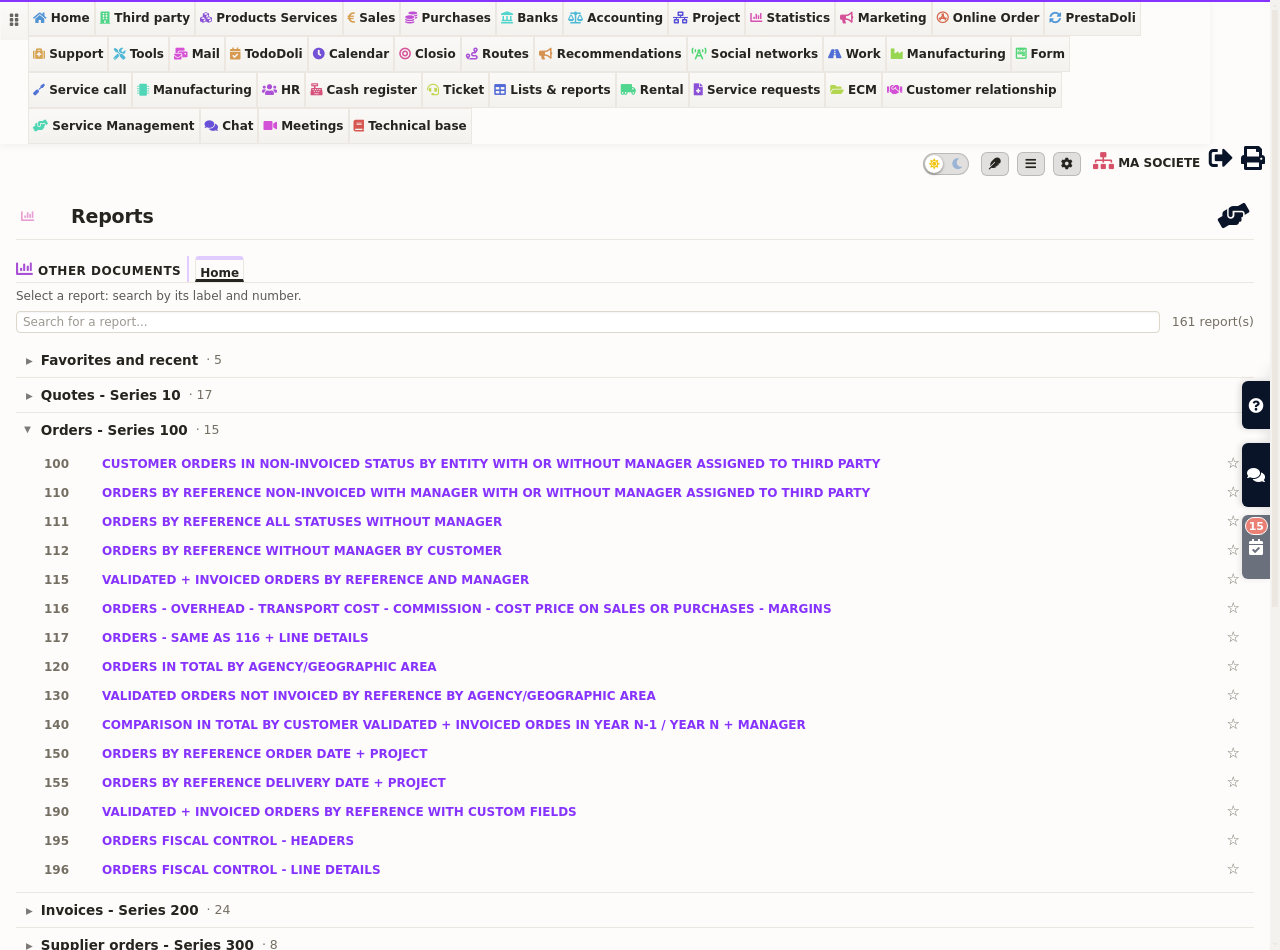
Next, the results screen asks for your criteria. First you set a start date and an end date. Then, depending on the report, you filter by manager, by company, by entity or by category.
Your customer orders by department, by region and by manager
Your customer orders now read just like your invoices: totalled by department, by region or by manager, in amounts excluding tax. As a result, you see where your order book is building up, even before invoicing.
These reports cover validated and processed orders. In addition, the total by manager shows how many orders each person handled. It also groups customers with no assigned manager on a separate line, so the total stays complete.
Finally, in the totals by department and by region, you can pick a manager to see only their territory. The same choice also works for invoices totalled by region.
The right export format for what you intend to do
The format, for its part, is no longer chosen in advance. You run the report first; then the “Export this report” bar offers Excel, PDF or CSV right under the “Run report” button.
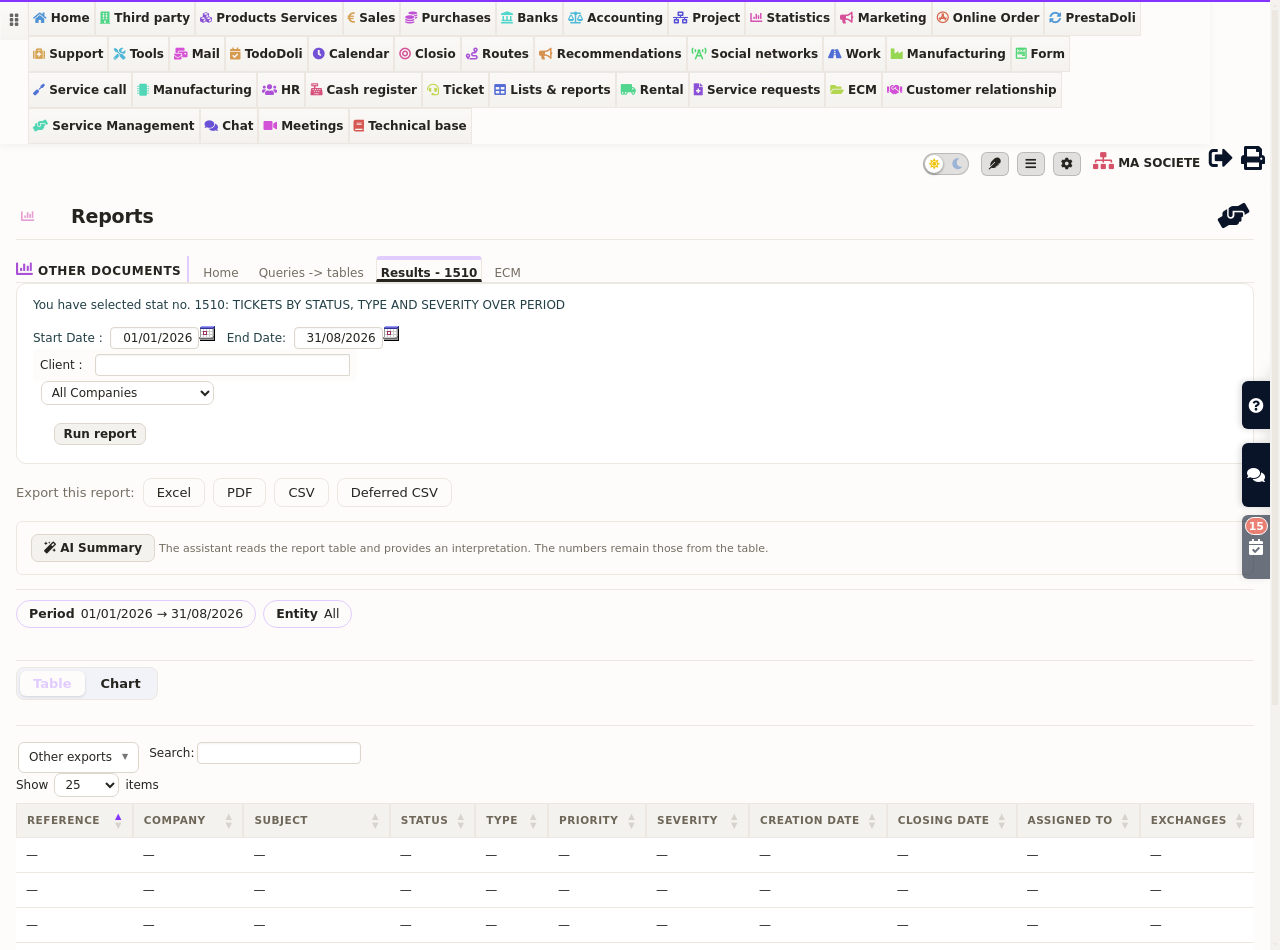
- HTML table — the result appears on screen. You sort columns in one click and read the totals at the bottom.
- Excel — the workbook arrives with real numbers in the cells. Your totals are live formulas: filter the table, and the sum recalculates.
- PDF — the layout is fixed, therefore ideal to circulate or archive.
- CSV — the lightest format, to open in any spreadsheet.
Very large volumes run in the background
Ready-made business reports also cope with history. A report spanning several years can represent tens of thousands of rows; in that case, choose the deferred CSV.
Your request then goes into preparation while you carry on working. Finally, an e-mail warns you as soon as the file is available.
Find the right report by typing two words
The catalogue opens on a search bar. Type “unpaid”, “margin” or a number: the list narrows at once to the matching reports.
Furthermore, the series stay collapsed by default. Therefore you keep a summary that fits on screen, and you expand only the family you care about.
Finally, the star at the end of a line pins a report to your favourites. Thus the ones you run every month rise to the top, next to the reports you opened last.
Know straight away why a report returns nothing
An empty result explains itself at a glance. Indeed, the screen lists the criteria that really filter the calculation.
First, the applied criteria appear as chips above the table: period, entity, customer, supplier, category or warehouse. Each carries its business label — “Category: Materials”, “Warehouse: Main store” — rather than an internal number. Thus you immediately recognise the filter at fault.
Then, the screen distinguishes two situations. A criterion you have just chosen in the form is simply displayed. By contrast, a criterion inherited from a report viewed just before carries the note “inherited from your session”: that is the one to look at first.
A cross is then enough to remove it, and the report runs again immediately. Moreover, when no row comes back, the message repeats the list of criteria in force, period included. In other words, you see what the software is really calculating.
Follow your support desk: tickets, service calls and after-sales
A set of reports joins the catalogue. First a Support series devoted to tickets:
- the flow of tickets received over the period, by status, type and severity;
- response and resolution times, month by month;
- the customers who call on you most, with the number of exchanges;
- each agent’s workload and what remains on their plate;
- the link from ticket to service call: time spent and action taken.
Next, the Service calls series grows. You notably obtain the amount left to invoice — completed calls that have not yet produced an invoice —, time spent per technician separating billed from unbilled, breakdowns per equipment in the fleet, and copier meter readings.
Two reports cover after-sales exchanges: their recurring reasons and how quickly your teams read them.
A more readable table, and one gesture to export it
Column headings in the ready-made business reports now speak your language. For example, “Due date” replaces a technical label, and “Purchase price” becomes explicit.
Moreover, wide tables scroll inside their own frame, without shifting the page. Their header row stays visible while you scroll.
As for the export, it is chosen once the report has run: the “Export this report” bar appears right under the “Run report” button. You first look at what the report contains, then you send it to Excel, PDF or CSV. Some reports also offer a switch to a chart, built from the table on screen.
Every report respects your colleagues’ permissions
Until now, permissions on the ready-made business reports mostly governed the menus. In other words, a report hidden from the menu could still be opened through a direct link or a bookmark.
Every report now checks your permission at the moment you open it. Thus sensitive figures — accounting, purchases, margins — stay within the scope you defined for each colleague.
In practice, nothing changes for most users: the catalogue and the series pages only offer the reports you are entitled to. Moreover, administrators keep access to everything.
By contrast, if you open an old bookmark pointing to a report outside your scope, a message explains it. It gives the exact name of the permission you lack — for example “Accounting statistics access” — and where your administrator finds it: your user record, Permissions tab, Statistics module.
Thus you know what to ask for, and your administrator has a single box to tick.
A reading of the table proposed by AI
An “AI Summary” button can appear right under “Run report”, above the table. It then comments on the figures in a few lines: trend, gaps, salient points. Thus you have the reading in front of you without scrolling through the whole result.
This function stays switched off by default and is enabled on request on your DoliPlus. Indeed, it sends the already-calculated figures to an artificial intelligence service outside your installation. Consequently, you decide yourself whether to open it: as long as it is off, no data leaves your premises. Tell us if you want it, and we switch it on for your instance.
Targets and margins: steering in the same place
The Miscellaneous area opens two steering tools. On the one hand, you enter your sales targets, then you follow the gap with the actual figures, month by month.
On the other hand, you consult the detail of your margins. Thus you see not only what you sold, but above all what it earned you. To go further: entering sales targets and margin and cost price calculation.
Moreover, your quote, order and invoice reports now show the cost price next to the purchase price, together with the total charges that explain the gap. Therefore you measure real profitability without leaving the report you already use. However, if you track no charges at all, that column stays hidden.
Two settings to adapt your reports
The configuration of your ready-made business reports comes down to two settings. First, you exclude the companies that would distort your analyses, such as your internal accounts or your tests.
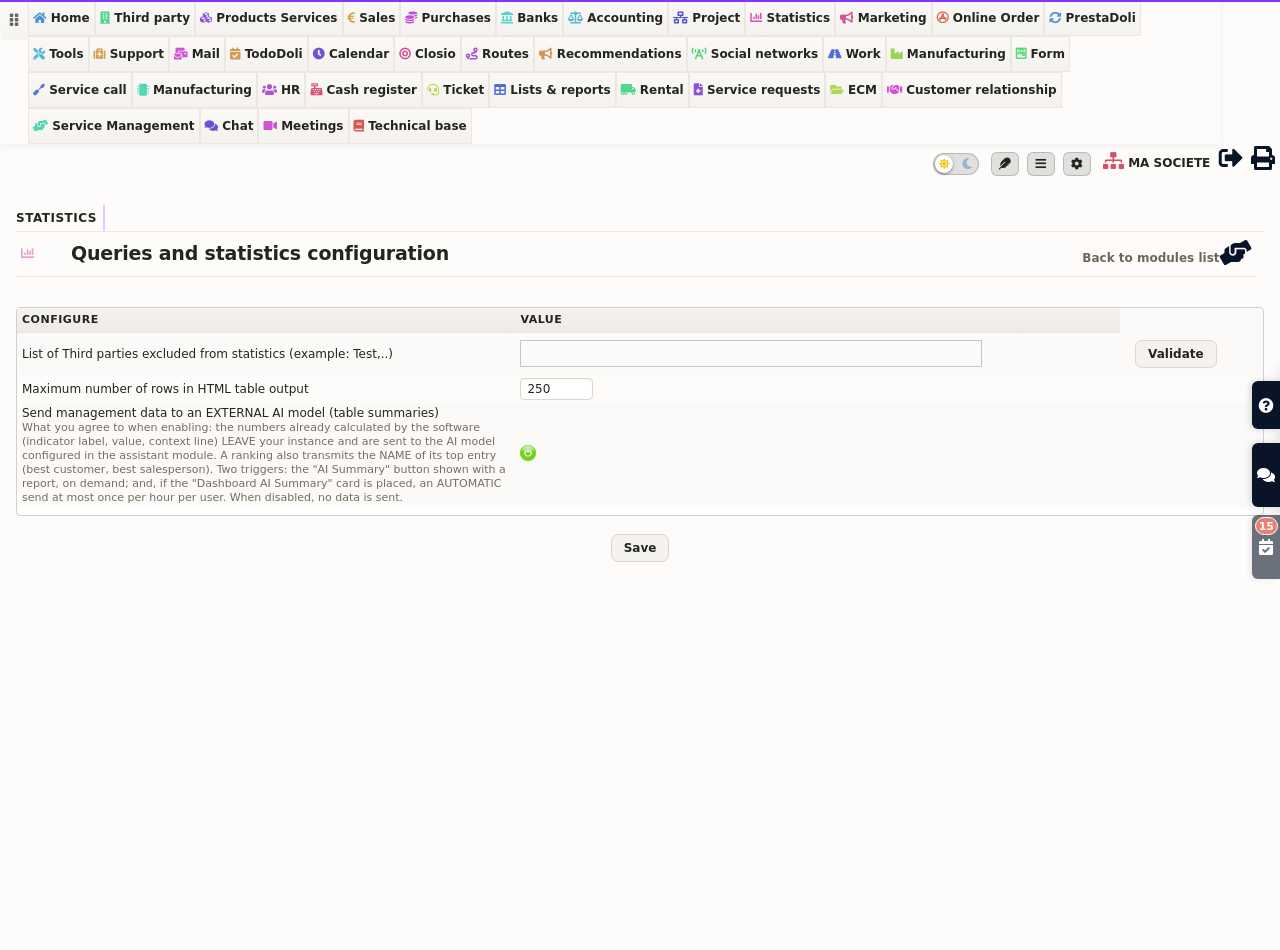
Then, you set the number of rows shown on screen. That ceiling only concerns the display, however: your exports stay complete.
Finally, each user receives rights area by area. Therefore you open the commercial reports to your sales team, without giving it access to accounting.
A separate right governs margin figures: “View margins”. Without it, the report opens as usual, but the purchase price, total charges, cost price, margin rate and margin columns stay hidden — on screen and in exports alike. Therefore you can hand revenue tracking to whoever needs it, while keeping margin figures for those they concern.
Going further
- The customisable dashboard — your indicators on the home page and on every business screen
- The revenue dashboard — the trend of your activity at a glance
- Dynamic lists and tables — build your own filterable views
- The accounting export — hand your entries to your chartered accountant
Related Entrées