 on 5 September 2026
 Revenue Dashboard
The revenue dashboard: your commercial compass
A revenue dashboard answers one simple question: how do your sales compare to targets? Tracking activity in spreadsheets remains tedious and quickly outdated.
DoliPlus calculates these metrics for you. This saves time and lets you make decisions based on reliable figures rather than gut feeling.
These views are found in the Statistics section under the “Dashboards” tab. They draw directly from your actual invoices, orders and quotes.
Two complementary dashboards
DoliPlus offers two complementary views. The first looks at the past year, while the second forecasts upcoming months.
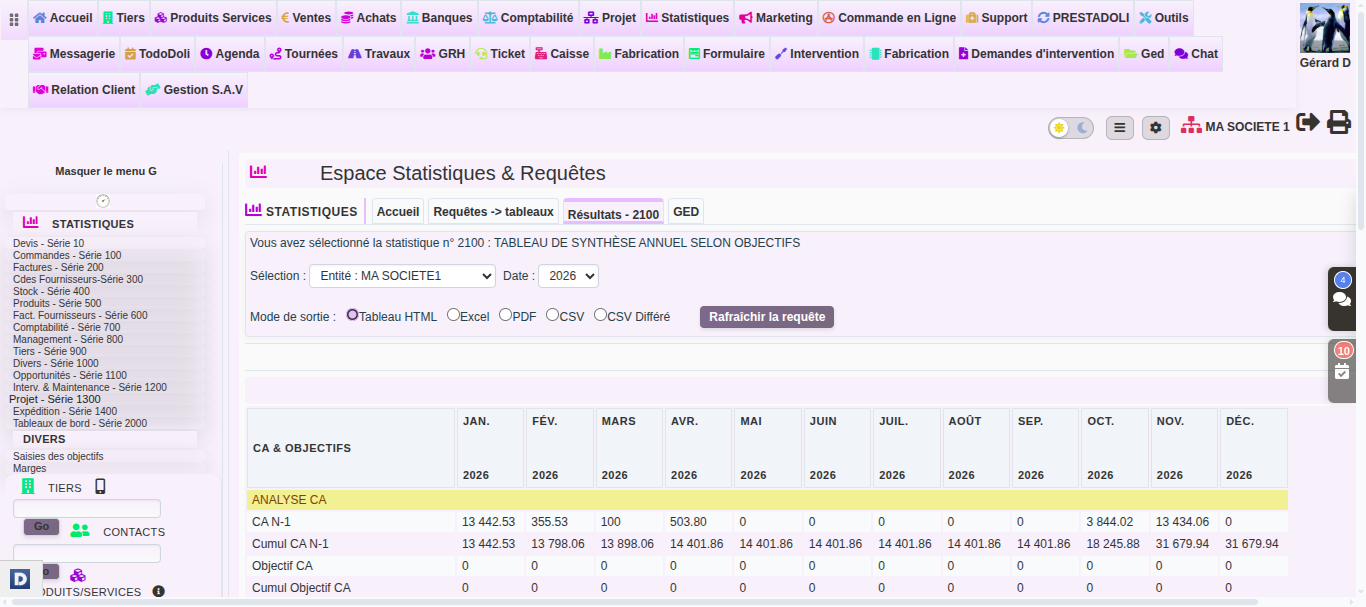
Annual summary against targets
This first view compares achieved revenue with monthly targets. The gap between forecast and actual jumps out immediately, helping you spot strong periods and months needing support.
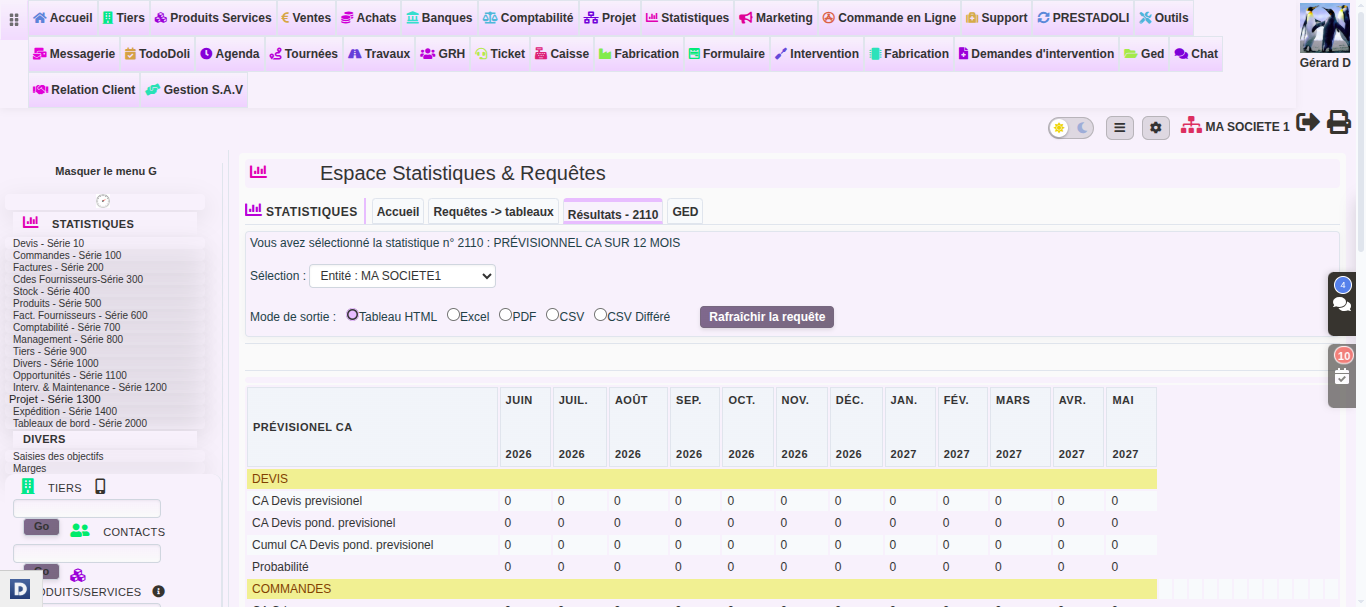
Twelve-month forecast
The second view projects activity over the next twelve months, weighting quotes by their likelihood of conversion. This forecast revenue dashboard helps anticipate workload and cash flow.
How to display a revenue dashboard
Displaying it is straightforward. Follow these steps:
- Open the Statistics menu, then the Dashboards tab.
- Select your preferred view (annual summary or forecast).
- Choose the relevant entity and year to analyse.
- Finally click Refresh query to display results.
Getting your annual revenue for your accountant
The revenue dashboard also answers the year-end request. In the annual summary, choose your company and the year, then read the “Actual Revenue” row month by month. Next, in December, the “Cumul CA” (cumulative revenue) row gives the total for the year.
What this figure counts exactly
The calculation is based on your validated invoices, at their issue date; a draft does not count until it is validated:
- amounts excluding tax;
- standard, replacement and progress invoices;
- credit invoices, which are deducted;
- however, neither abandoned invoices nor invoices replaced by another one.
As for deposit invoices, they count in the month you issue them. However, if the option “PG23: Converts down payment invoices into a payment method” is active (Setup → PDF/Interface settings), the deposit becomes a simple means of payment: the revenue is then recorded on the final invoice. Learn more about the advance invoice
Does your accountant also want amounts including tax, or the invoice-by-invoice detail? In that case, open the customer invoice list: it shows the “Amount excl. tax” and “Amount incl. tax” columns. Filter on the financial year, then export to Excel. See dynamic tables
Each dashboard exports in one click. You can download it in Excel, CSV or PDF format, for example for a management meeting. These data also feed external business intelligence tools.
Next steps
- Entering sales targets
- Statistics and Queries section
- Management-oriented profit and loss
- Building reports with Power BI
Finally, for management theory, see the definition of dashboard on Wikipedia.